I’m cleaning data. Tracing changes to Ghana’s district divisions, trying to make different datasets match. Data collected by different ministries is not always consistent, district names are spelled differently, districts having been split means data collected at different times needs to be merged. Having several spreadsheets and a GIS open at once on my two screens, just to make sure all edits are done in the same way.
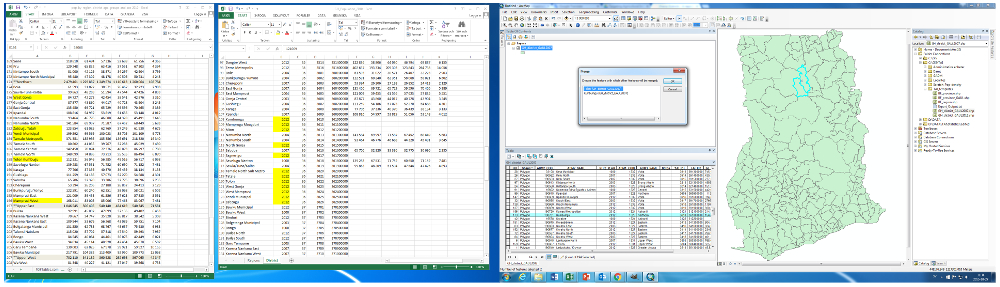
It’s a mountain of work. Hundreds of data points that need to be checked and coded. And for what? Several days of work. And the result: three maps.
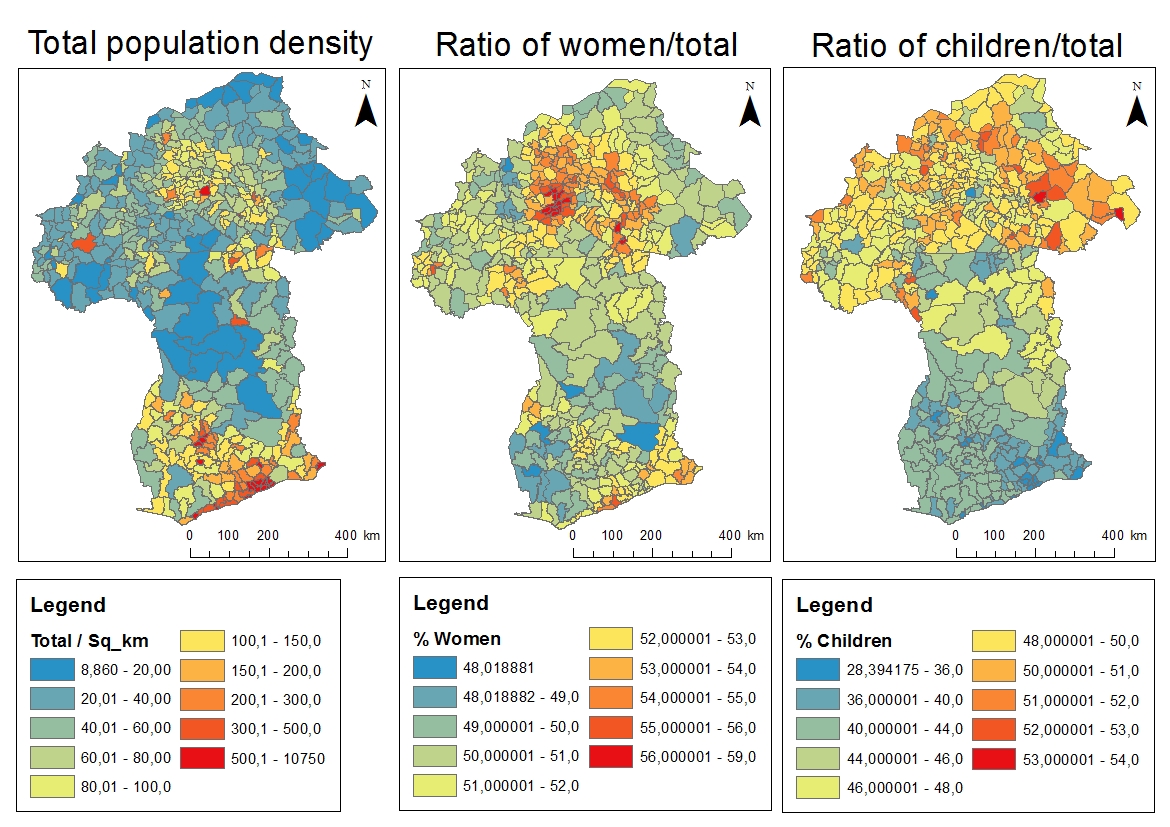
Maps of Ghana and Burkina Faso showing information about demographics. At least the colors are pretty.
I’ve come to appreciate like never before the meticulous way in which Swedish statistics are gathered and stored. To produce exactly the same maps for Sweden would have taken an hour, max, instead of three days. Because everything is stored in easily accessible databases, coded according to the same system, be it number of libraries in a municipality or forest cover. Sweden is a wonderful country to do research in.
I am not, though. So tomorrow, I’m going back to the laborious work of data cleaning.
